Atradius Atrium
Log in op ons online credit management platform. Het biedt u toegang tot alle Atradius online applicaties in één omgeving.

 Nederland
 Australië
 België
 Brazil
 Bulgarije
 Canada
 China
China
 Denemarken
 Duitsland
 Finland
 Frankrijk
 Griekenland
 Hongarije
 Hongkong SAR
 Ierland
 India
India
 Italië
 Japan
Japan
 Litouwen
 Mexico
Nederland
Mexico
Nederland
 Nieuw-Zeeland
 Noorwegen
 Oostenrijk
 Polen
Polen
 Portugal
 Roemenië
 Singapore
 Slovenië
 Slowakije
 Spain
Spain
 Tsjechische Republiek
 Turkije
 Verenigde Staten
 Verenigd Koninkrijk
 Zweden
 Zwitserland

")

Ondanks laag vertrouwen sterkste groei Nederlandse export in twee jaar

EU-wetgeving en economische onzekerheid zorgen voor een...
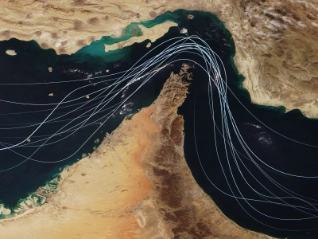
Nu de oorlog in het Midden-Oosten op een kruispunt staat, is het essentieel om in scenario’s te...
Atradius delivered strong financial results in 2025 despite economic headwinds and global...

This conflict marks an unprecedented development with potential effects for country risk across the region and beyond. The...

By voiding most IEEPA tariffs, the Supreme Court has reset the legal landscape, heightening uncertainty without meaningfully...
Kijken op 7 van 89
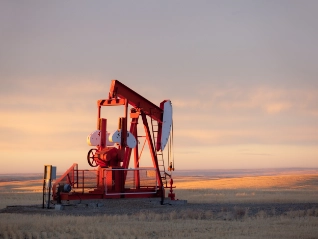
Production growth in 2026, but below its potential

The global energy transition is slowing, raising climate and financial risks for fuel-importing countries

A fractured outlook of declining demand and above average growth
Tariff-related economic uncertainty still weighs on commercial construction activity

Accelerating AI demand drives one of world’s fastest-growing industries

Asia drives pharma growth, although outlook for all regions remains healthy
Amid a fragmented global landscape, the EU and India are pursuing different strategies to build economic resilience...
Kijken op 7 van 174
After adopting Atradius trade credit insurance, MBS found that their credit control processes improved so much that staff had more time to devote to clients.
Lacto chose Atradius over all other trade credit insurance companies, due to the responsiveness of their Account Manager and the quality of communication.
Australian startup Ayonz partnered with us to build a robust risk management platform, enabling them to focus on their core business and enjoy growth.
After some experiences of bad debt, Vero Design describes how we provide them with peace of mind, allowing them to focus on fireplace production and sales.
Inheriting Atradius credit insurance after an acquisition enabled E.ON to benefit from our dedicated solution for multinationals.
French lighting designer, Corep, uses credit insurance to maximise opportunities for growth and enable favourable factoring terms to secure cash flow.
Understanding the unique challenges Covid-19 brought to the healthcare industry, Atradius supported Philips Capital’s sector financing solutions.
Kijken op 7 van 19