Atradius Atrium
Log in op ons online credit management platform. Het biedt u toegang tot alle Atradius online applicaties in één omgeving.

 Nederland
 Australië
 België
 Brazil
 Bulgarije
 Canada
 China
China
 Denemarken
 Duitsland
 Finland
 Frankrijk
 Griekenland
 Hongarije
 Hongkong SAR
 Ierland
 India
India
 Italië
 Japan
Japan
 Litouwen
 Mexico
Nederland
Mexico
Nederland
 Nieuw-Zeeland
 Noorwegen
 Oostenrijk
 Polen
Polen
 Portugal
 Roemenië
 Singapore
 Slovenië
 Slowakije
 Spain
Spain
 Tsjechische Republiek
 Turkije
 Verenigde Arabische Emiraten
 Verenigde Staten
 Verenigd Koninkrijk
 Zweden
 Zwitserland

")

De nieuwste Atradius Risk Map voor het tweede kwartaal van 2026 laat zien hoe...


Het werkkapitaal staat onder druk in Centraal- en Oost-Europa

Technologie, menselijke expertise en geopolitieke verschuivingen zullen de bepalende factoren zijn die de toekomst van...
De handelsovereenkomst tussen de EU en de VS is deze maand een stap dichter bij de tenuitvoerlegging...

In juni en juli zal de hele wereld in de ban zijn van het voetbal, maar in hoeverre hangen economische kracht en...

De crisis in het Midden-Oosten stelt de wereldwijde toerismesector voor een uitdaging. De vraag blijft op peil, maar er doen zich ingrijpende...

Uit de Betalingsbarometer blijkt dat het betalingsgedrag bij B2B-transacties in West-Europa...
Kijken op 7 van 103
Ondanks eerdere zorgen lijkt het erop dat de wereldeconomie een stagflatiescenario zal weten te vermijden. De energieprijzen zijn gedaald na het bestand...


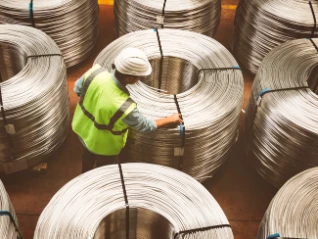
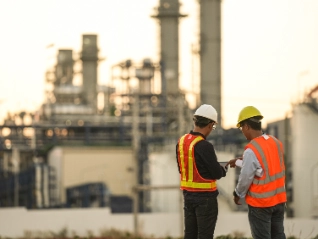
De productiegroei zal in 2026 afvlakken na de sterke stijging van vorig jaar, die vooral in het...
In heel Centraal- en Oost-Europa hebben bedrijven moeite met hun cashflowplanning, nu de kans op faillissementen toeneemt
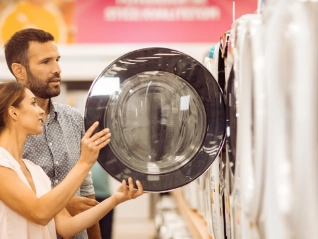
Nederlandse B2B-leveranciers opereren in een zakelijke omgeving waar betalingsdiscipline hoog in het vaandel staat, maar waar toenemende economische en...
Door de verscherpte toegang tot financiering, onzekerheid en geopolitieke onrust verschuift de aandacht van groei naar het veiligstellen van de...
Households rein in spending in response to Gulf conflict price rises
Chemicals production growth to slow down sharply due to the Gulf war
Kijken op 7 van 182
After adopting Atradius trade credit insurance, MBS found that their credit control processes improved so much that staff had more time to devote to clients.
Australian startup Ayonz partnered with us to build a robust risk management platform, enabling them to focus on their core business and enjoy growth.
After some experiences of bad debt, Vero Design describes how we provide them with peace of mind, allowing them to focus on fireplace production and sales.
Inheriting Atradius credit insurance after an acquisition enabled E.ON to benefit from our dedicated solution for multinationals.
French lighting designer, Corep, uses credit insurance to maximise opportunities for growth and enable favourable factoring terms to secure cash flow.
Understanding the unique challenges Covid-19 brought to the healthcare industry, Atradius supported Philips Capital’s sector financing solutions.
Luxury Italian knitwear, Gran Sasso, use the Atradius API to maximise efficiency and safe trade while managing customers in more than 100 countries.
Kijken op 7 van 17