Atradius Atrium
Log in op ons online credit management platform. Het biedt u toegang tot alle Atradius online applicaties in één omgeving.

 Nederland
 Australië
 België
 Brazil
 Bulgarije
 Canada
 China
China
 Denemarken
 Duitsland
 Finland
 Frankrijk
 Griekenland
 Hongarije
 Hongkong SAR
 Ierland
 India
India
 Italië
 Japan
Japan
 Litouwen
 Mexico
Nederland
Mexico
Nederland
 Nieuw-Zeeland
 Noorwegen
 Oostenrijk
 Polen
Polen
 Portugal
 Roemenië
 Singapore
 Slovenië
 Slowakije
 Spain
Spain
 Tsjechische Republiek
 Turkije
 Verenigde Staten
 Verenigd Koninkrijk
 Zweden
 Zwitserland

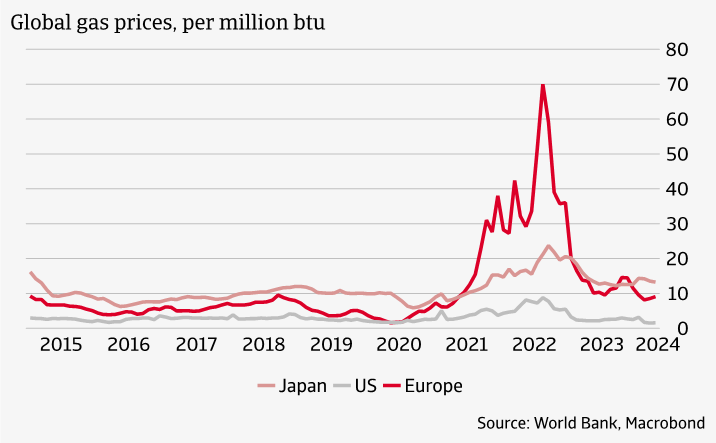
The European gas market already started to see price increases before the large-scale conflict between Russia and Ukraine. Since mid-2021, Russia had already begun to reduce its sales to Europe. This trend deteriorated after the Russian invasion, with pipeline gas from Russia progressively diminishing throughout 2022. The market turbulence was exacerbated by lower hydropower and nuclear output in 2022 and the need for high gas storage injections across Europe. This drove gas prices to record-highs. The European TTF gas price spiked at USD 70 per million btu in August 2022, an increase of more than 350% year-on-year.
Indirectly also prices in other regions – such as the US and Asia – were affected. Although each market traditionally has its own price mechanism, they are increasingly interconnected by the ability of LNG tankers to seek out the most advantageous commercial destination. The steep increase in LNG prices in 2022 due to high demand from Europe had a knock-on effect in Asia, which traditionally is a big LNG importer. What mitigated the price impact in Asia was the subdued demand from China, as the country during 2022 was still in lockdown due to the Covid pandemic. The price response in the US was even more subdued because the country is a net exporter of gas.
In 2023, gas markets gradually eased owing to ongoing demand reductions due to energy saving, together with lower gas storage filling needs and healthy LNG inflows. This softened natural gas prices despite the continued decline in Russian pipeline gas deliveries to the European Union. The European TTF gas price ended the year at USD 12 per million btu. Nevertheless, gas prices were still above pre-crisis levels (the average price between 2016 and 2020 was USD 5.2). LNG is now playing the role of marginal supply to Europe, meaning that any news of a tightening of the global LNG market is bound to impact European prices.
Pipeline supplies from Russia to Europe (EU) dropped from 166 billion cubic metres (bcm) pre-crisis (average 2019-2021) to less than 30 bcm in 2023. This is a decline of more than 80%. LNG imports from Russia increased between 2021 and 2023 in absolute amounts (from 14 bcm in 2021 to 18 bcm in 2023) but declined as a share of total LNG imports (from 18% to 13%). The share of Russian gas (pipeline and LNG) in total EU gas imports declined from 44% pre-crisis to 9% in 2023.
Pipeline gas that is still entering Europe from Russia is entering via the Ukraine transit route and via Turkstream in Turkey. The other two major pipelines – Nord Stream and the Yamal pipeline via Poland – effectively closed between May 2022 and September 2022. Supply through Nord Stream ended after the pipeline was blown up in September 2022. The Yamal pipeline ceased operations after Poland rejected Russia's demand that payments for gas be made in Russian rubles. Even though gas is still entering from Ukraine, this is likely to change at the end of 2024, when the Russia-Ukraine gas transit contract expires. It is widely expected that after this the gas flows from Ukraine will cease completely, amounting to 14 bcm in lost supply.
The major challenge for Europe was to find alternative sources to replace Russian gas supply. These sources covered about 60% of the gas deficit that emerged due to lower Russian pipeline supplies. A small part of the lost Russian supply could be compensated by higher pipeline imports from Norway, which rose from 86 bcm in 2019-2021 on average to 90 bcm in 2023.
A bigger part of lost Russian pipeline gas was replaced by higher liquefied natural gas (LNG) imports. LNG imports rose from 81 bcm pre-crisis to 133 bcm in 2023. The share of LNG in total EU imports rose from 20% in 2021 to 42% in 2023. The United States was the largest LNG supplier to the EU in 2023, representing around 40% of total LNG imports.
Import from US grew from 19 bcm in 2021 to 56 bcm in 2023. The growing position of US LNG on the European market partly has contractual reasons, as the US mainly relies on destination-flexible volumes that are sold for spot prices (in contrast to two other major LNG producers – Australia and Qatar – which rely more on long-term contracts). Europe is also still importing some Russian LNG due to long-term contractual commitments.

The higher dependence on LNG is changing the nature of the European gas market. Europe was traditionally seen as the balancing market for LNG, taking up in storage the excess supply not needed elsewhere (most notably in Asia). That situation changed dramatically in 2022, with Europe becoming more a baseload than a balancing market.
Russia’s invasion of Ukraine and the rising need for LNG has pushed EU member states to further develop their LNG importing infrastructure. Several new LNG terminals opened in 2022 and 2023. These include floating LNG terminals in the Eemshaven (Netherlands), Wilhelmshaven (Germany), Inkoo port (Finland) and Piombino (Italy). Thanks to these investments, the EU’s LNG import capacity grew by 40 bcm in 2023, and an additional 30 bcm is expected to become available in 2024. Notably, Germany, which had no LNG terminal until the end of 2022, has plans to open several LNG importing facilities in 2024.
Another response to the gas crisis was on the demand side. Total EU gas demand was around 20% lower in 2023 compared to pre-crisis (average of 2019-2021). The contribution to the total gas demand reduction was highest for households, followed by industry and the power sector.
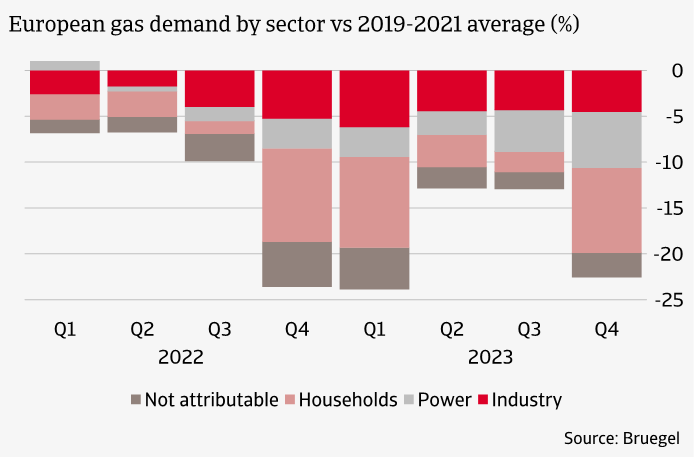
Gas consumption in the power sector is volatile and driven by the availability of alternative power generation, while industrial demand has been consistently depressed. Meanwhile, household demand also shows some volatility, which is likely driven by weather conditions.
Figure 4 compares changes to gas demand across all EU countries. In a number of countries such as Finland, Latvia, Sweden, Lithuania, Estonia and the Netherlands, the decline was particularly large. The countries with a relatively sharp decline in gas demand included, not surprisingly, a number of countries with a high import dependence on Russia. The Baltic countries and Finland imported virtually all of their consumed gas from Russia before the invasion of Ukraine. In Finland, the gas demand was relatively painless, because gas played a small role in the energy mix even before the Russian invasion.
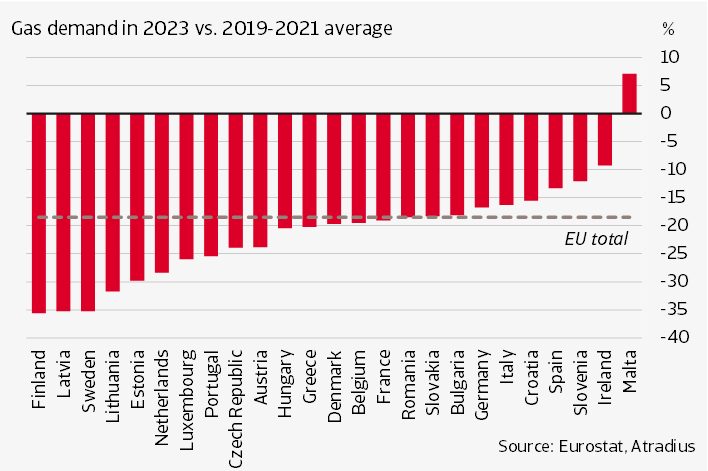
For Sweden and the Netherlands, which also saw a sharp drop in gas demand, dependence on Russia was much lower. In the Netherlands, demand mainly adjusted through price incentives, as gas became a lot more expensive in 2022. In Sweden, gas already played a small role in the total energy mix before 2022, and as in Finland, the adjustment in demand was relatively painless.
At the other end of the spectrum, demand for gas decreased by much smaller percentages in countries like Slovenia and Sweden, or even increased in the case of Malta. In these countries, the dependency on Russian gas pre-crisis was virtually non-existent. Malta and Slovenia had generous subsidies schemes and strong price regulations during the energy crisis. Malta even mandated its state-owned energy provider to freeze electricity prices at their 2014 level.
According to the IEA, gas use in the European industry fell by almost 25% in 2022, over half of which was the result of curtailment in energy-intensive industries. The decline in industry demand is not surprising given the increase in gas prices since the start of the gas crisis. The gas price for large industrial consumers roughly tripled between the first half of 2021 and the second half of 2022 (from EUR 0.022 per KWh in H1 2021 to EUR 0.077 in H2 2022). One year later, in the second half of 2023, the gas price has decreased somewhat but remains high (EUR 0.059). We do see that the lower gas price is starting to translate into higher industrial demand, with Germany setting the tone as the largest industrial consumer of gas in Europe.
Since the start of the Ukraine conflict, a strong policy response was put in place to counter the effects of the energy crisis. Policy measures can be divided into two categories: (1) structural measures that address gas demand, supply, and storage, and (2) fiscal relief measures primarily intended to support firms and households affected by higher gas and energy prices.
In terms of structural measures, the REPowerEU plan forms the EU’s central policy framework. REPowerEU aims at rapidly decreasing the European Union's dependency on Russian fossil fuels. The plan’s principles were implemented through regulatory interventions that set storage capacity targets, introduced gas consumption reductions, and established a joint gas-purchasing facility and a correction mechanism to curb gas prices. Moreover, EU countries enhanced their LNG import capacities.
The structural measures can be seen as a success, even though they temporarily resulted in very high LNG prices. The gas demand reduction target of 15% between 1 August 2022 and 31 March 2023 was achieved, and the target has subsequently been extended twice and currently lasts until March 2025. Moreover, the requirement to fill underground gas storage by 80% as of 1 November 2022 was also achieved, as was the requirement to increase this to 90% in 2023. The EU launched its Joint Gas Purchasing mechanism in April 2023, with the aim of making use of the European Union’s collective market power to negotiate better prices with international suppliers.
Besides structural measures, the EU has also adopted several fiscal support measures in the form of temporarily lower energy taxes, energy price ceilings, and fiscal transfers to vulnerable parts of the population. The fiscal response provided in response to the energy crisis amounted to slightly under 2% of GDP for the eurozone in 2022 and 2023. For 2024, this is estimated to drop to 0.5% GDP. In absolute amounts, support amounted to EUR 540 billion in the EU, of which Germany alone accounts for EUR 158 billion. In relative terms, support varied between 6.8% GDP in Malta to 0.5% GDP in Denmark.
The sharp decline in the supply of Russian gas coming to Europe via pipelines underlines the challenge Europe faced during the energy crisis. It has responded to this challenge through a combination of lower demand and higher LNG imports.
This does not alter the fact that the European gas market will remain fundamentally tight in the coming years. How the European gas price develops will therefore depend crucially on the global supply of LNG and the demand for LNG in the rest of the world, especially in Asia. Even minor shifts in the supply-demand balance could create volatile price movements. In the medium term, after 2025, gas balances are expected to ease as the next big wave of LNG supply becomes available to the global market.
The relatively high and volatile gas prices that are expected for the coming years have implications for households and industry. Now that fiscal support related to the energy crisis has largely been phased out, households are again exposed to market prices. The good news is that the gas price is considerably lower than at the height of the gas crisis. Moreover, permanent fiscal support would not have been such a good idea either, as it delays the necessary adjustments on the demand side.
Another concern is that the higher gas price undermines the competitiveness of the (energy-intensive) European industry and, in the fear of some policymakers, could lead to deindustrialization. A survey by the Federation of German Industries (BDI) in September 2022, at the height of the gas crisis, reveals that many companies in the industrial sector were very concerned. Around one in three of the businesses polled see increased energy and raw material costs as an existential threat. Around 9% of the companies that took part in the survey also stated that they had cut back or completely reduced their manufacturing in Germany. Some 17% of the businesses surveyed were specifically considering offshoring production.
Indeed, production data shows that the energy-intensive part of industry has seen a prolonged production decline after the 2022 energy crisis. The added value in the energy-intensive part of the industry decreased by 6% between Q1 2022 and Q4 2023 (see figure 5). On the other hand, the added value of the entire industrial sector has remained virtually stable, a signal that they have been able to deal with the higher gas price reasonably well. A combination of more efficient production, a switch from gas to other fuels and sourcing more energy-intensive inputs from outside Europe have allowed manufacturers to limit the damage to production.
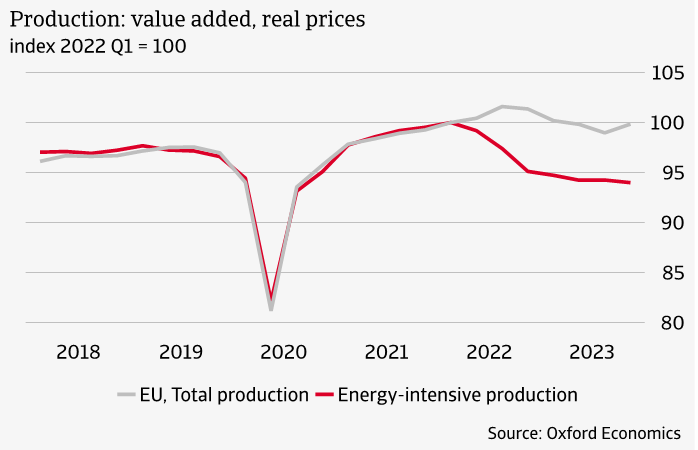
Moreover, another reason behind the relatively strong production decline in energy-intensive sectors is that they went through a prolonged destocking cycle post-pandemic, one that was driven by monetary tightening and lower demand for intermediate industrial goods. However, there are now clear signs that an inventory upcycle is nearby. Destocking pressures are easing rapidly for energy-intensive sectors, in particular for the chemical and paper industries. In both sectors, firms' assessments of their inventories have improved rapidly. Monetary policy easing alongside a rebound in real incomes should also bolster demand in interest rate sensitive sectors such as durable goods and construction. These are key clients for many energy-intensive sectors.
Although it is too early to draw definitive conclusions, the industrial sector seems to adapt well to elevated energy prices and the economic recovery provide scope for improvements in downstream sectors, from which energy-intensive industry is likely to benefit. While it might be that parts of the energy-intensive sectors will look beyond European borders, especially if energy prices stay elevated, we do not expect a large-scale exodus of industry from Europe.
Theo Smid, Senior Economist
theo.smid@atradius.com
+31 20 553 2169