Global trade growth has slowed significantly in recent years. For 2015, Atradius predicts just 1% international trade growth. This implies a difficult environment for exporters.
Summary
- Global trade growth has slowed significantly over the past years from 7% between 1992 and 2006 to 3% in the past three years. The slowdown makes it much more difficult for exporters to grow.
- This is largely due to structural changes such as a halt in the global supply chain diversification and partly due to the current sluggishness of the global economy.
- For 2015, Atradius forecasts 1% global trade growth due to very weak trade in China in the first half of the year.
- Global trade growth is expected to remain modest over the coming years. However, it may be boosted by the regional trade deals currently under negotiation.
The slowdown in global trade growth
World trade growth has been sluggish since the Global Financial Crisis. Average annual world trade growth slowed from 7.4% in the period 1992-2006 to 2.7% from 2012 to 2014. Trade growth in volumes continued to perform poorly over the first five months of 2015 according to data from the Netherlands Bureau for Economic Policy Analysis. Annual global trade growth was 0.8% in July this year. The sluggish growth is visible across both advanced and emerging markets. Import growth by advanced markets reached 2.9% in July 2015, compared to the same month in 2014, while growth in emerging markets was only 0.2%. There are nonetheless large regional differences.
In 2014, import growth was weakest in Latin America, reaching only 0.3%. This was related to the poor economic conditions in its largest markets; Brazil, Argentina and Venezuela. Import growth was also modest in the eurozone (+2.9%) and Sub-Saharan Africa (+3.1%). Much higher growth rates were visible in the Middle East and North Africa, where imports expanded 6.4%. Also in developing Asia imports rose rapidly at 6.2%, partly boosted by a 7.1% increase in China. Despite the low headline figures, some regions are still showing strong import growth rates, albeit that even for those, the current growth rates may be much lower than in the past.
The trade growth figures have been structurally below the IMF and WTO forecasts over the past six years. As a result, there has been a debate about whether or not the low growth figures represent a structural change in trade flows. A structural change would also imply that global trade growth will remain low in the coming years, even if global economic growth picks up. There is increasingly more evidence that this is the case.
Changing relationship
Before the financial crisis in 2009, the rule of thumb was that global trade grew at twice the rate of the global economy. However, since 2012 trade has been growing much slower, at more or less the same speed as the global economy. In other words, elasticity of trade with respect to economic growth has fallen significantly. This is important because the models used by the IMF and WTO to predict changes in trade flows take economic growth as one of the main drivers. A structural break in the trade–economic relationship may therefore explain the systematic overestimation of trade growth by both organisations over the past four years.
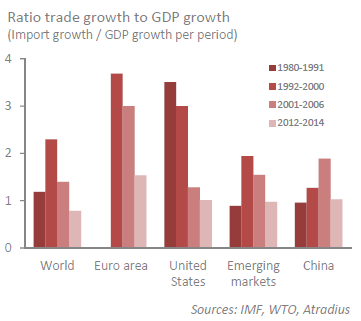
A closer look at the data reveals that the growth rate of global trade was twice the rate of global GDP growth only during the 1990s. The tendency for trade to grow more than twice as fast as GDP started in 1992 and ended around the turn of the century. While world income growth (measured by GDP) accelerated in the period 2000-2006, trade growth decelerated bringing the trade elasticity down from over 2 to 1.5, its level prior to 1992. The decline in the ratio since 2000 is also visible in the data on individual regions. The trade growth has slowed relative to GDP growth not only in the eurozone and the United States, but also in the emerging markets. It is now close to 1 everywhere. The fact that the ratio was also close to 1 at the global level in the 1980s suggests that perhaps the 1990s were an exception and that things are now reverting to normal.
Recent academic research by the IMF (2015) suggests that there has indeed been a structural change in the trade-GDP relationship and that trade growth will remain structurally lower. According to the study, about half of the weakness in the current trade figures is due to this structural change. The other half is due to the weakness of cyclical factors such as global economic growth. This means that world trade growth is going to be moderate in the upcoming years, even if economic growth and other cyclical factors improve.
Cyclical causes: eurozone and investment
A number of cyclical factors have weighed on trade growth over the past years, but are expected to wane over the coming years. The most cited cyclical reason to explain the current weakness in global trade is the crisis in the eurozone, which has resulted in a sharp contraction in import demand. As the eurozone is by far the world’s largest trade bloc, roughly accounting for one-third of total trade volumes, developments in this region materially impact global trade flows. Import volumes in the eurozone are still running 8% below their levels prior to the Global Financial Crisis. Given the slowly improving economic conditions in the eurozone, it is expected that import demand will pick up as well.
Structural changes: global supply chains
An earlier study by the IMF (2014) shows that the most important structural change has been in global supply chains. Three important events have significantly altered the global supply chains and contributed to the high trade elasticity in the 1990s: the ICT revolution, which resulted in falling trade costs, the removal of trade barriers that followed the completion of the Uruguay Round in 1994 and the creation of the World Trade Organisation (WTO), and the integration in the global economy of China after it started opening up in the 1970s. As a result of these developments, the production of goods and services was divided into stages, with production taking place at the most efficient producers, who may be located anywhere in the world.
However, there is some evidence that this development in global supply chains may have matured in the mid-2000s. Both in emerging Asia and emerging Europe, the foreign value added content of exports fell in the second half of the previous decade, in China from 36% in 2005 to 33% in 2009 according to the latest data available from the OECD. Apart from that, this process has most likely continued in the current decade; as suggested by the fact that the share of Chinese intermediate imports in total imports has fallen from 60% in the mid-1990s to 35% today. The flipside of the coin is that the domestic value added content of China’s exports is rising. This process is closely related to rising labour costs in China and suggests that the country is moving up the value added chain. The fall in China’s trade elasticity from 2.5% in early 2002 to 1% on average in recent years is thus most likely to be, to a large extent, permanent.
US no longer oil importer
Meanwhile, the shale revolution has also contributed to the decline in the pace of the global fragmentation process and its possible reversal since the mid-2000s. Cheaper energy in the US due to the shale boom seems to have halted the process of off-shoring and has possibly resulted in resourcing: US manufacturing imports as a share of GDP have been stable at about 8% since the turn of the century, after nearly doubling over the preceding one and a half decades (IMF, 2014). Additionally, US energy-intensive manufacturing exports have steadily increased (IMF WEO, October 2014). The move by many US companies, to bring production closer to home, has thus contributed to slower growth in global trade and to slower responsiveness of trade to income. Although it is highly unlikely that globalisation has gone into reverse or that Western companies will suddenly abandon production facilities in China or other Asian countries, some re-shoring or near-shoring will take place.
The potential of trade agreements
The slower pace of trade liberalisation in the 2000s compared to the 1990s and increased protection post-crisis seems to have played a minor role as well in lowering trade growth (IMF, 2015). The absolute number of protectionist measures has indeed risen since 2008 by 934 according to the WTO (2014). Still, at 4.1% of world merchandise imports (WTO, 2014), they concern a relatively limited share of global trade. In addition, there has been no large trade agreement since the Doha Round failed to result in a new agreement. A large number of smaller regional deals has made up for part of the loss, but the biggest regional deals are yet to be finalized. The Transatlantic Trade and Investment Partnership (TTIP) and the Trans Pacific Partnership (TPP) can both have a large positive effect on trade flows, but it’s uncertain if and when they will be concluded.
Atradius Global Trade forecast
Conclusion: changing trade flows
The period of rapid trade growth has ended making it much more difficult for exporters to grow. Global trade growth has slowed significantly over the past years from 7% between 1992 and 2006 to 3% between 2012 and 2014. This appears to be part of a structural change in the fundamental drivers of trade growth. Most importantly, the strong expansion of the global supply chain appears to have come to a halt. A future boost to trade may come from regional trade deals that are currently under negotiation. If these do not come to fruition, we may be stuck with modest trade growth for the foreseeable future. We predict 1% change in trade in 2015 and an increase to 3% to 4% per annum over the coming years. Exporters will have to put in more effort to generate growth, not just in 2015 but also over the coming years.
